Usage Reporting and Insights
Hive allow you to collect usage data from your GraphQL operations and use the data collected for the following purposes:
- Monitoring and Observability: view a list of all your GraphQL operations and their performance, error-rate, and other metrics.
- Tracing: view detailed traces of your GraphQL operations, with breakdown and timing of subgraph upstream requests.
- Schema Usage and Coverage: understand how your consumers are using your GraphQL schema, and what parts of the schema are not being used at all (see Schema Usage and Coverage).
- Schema Evolution: with the knowledge of what GraphQL fields are being used, you can confidently evolve your schema without breaking your consumers (see Conditional Breaking Changes).
How it works
To collect and report usage information from your GraphQL gateway, you’ll need to setup Hive Client within your GraphQL gateway, and have the metadata of your traffic reported to Hive.
Hive does not collect, process or store any data from your GraphQL operations or responses. Hive Client only transmits the metadata of your GraphQL operations to Hive: what fields were used, if there were any errors, etc.
The following information is included in usage reporting:
- Operation Name: the name of the operation, if it exists.
- Operation Type: the type of the operation (
query,mutation, orsubscription). - Coordinated: a simple array-based strcuture that represents what fields, arguments, and types
were used in the operation (for example:
Query.user,Query.user.idUser). - Client Identifier: the identifier of the client that sent the operation. This is useful to understand the distribution of your consumers.
- Date: the date and time when the operation was executed.
For additional reading, please refer to the following resources:
Monitoring and Observability
Once you have usage reporting enabled, and shipped your usage reports to Hive, you can view the usage data in the target’s Insights page.
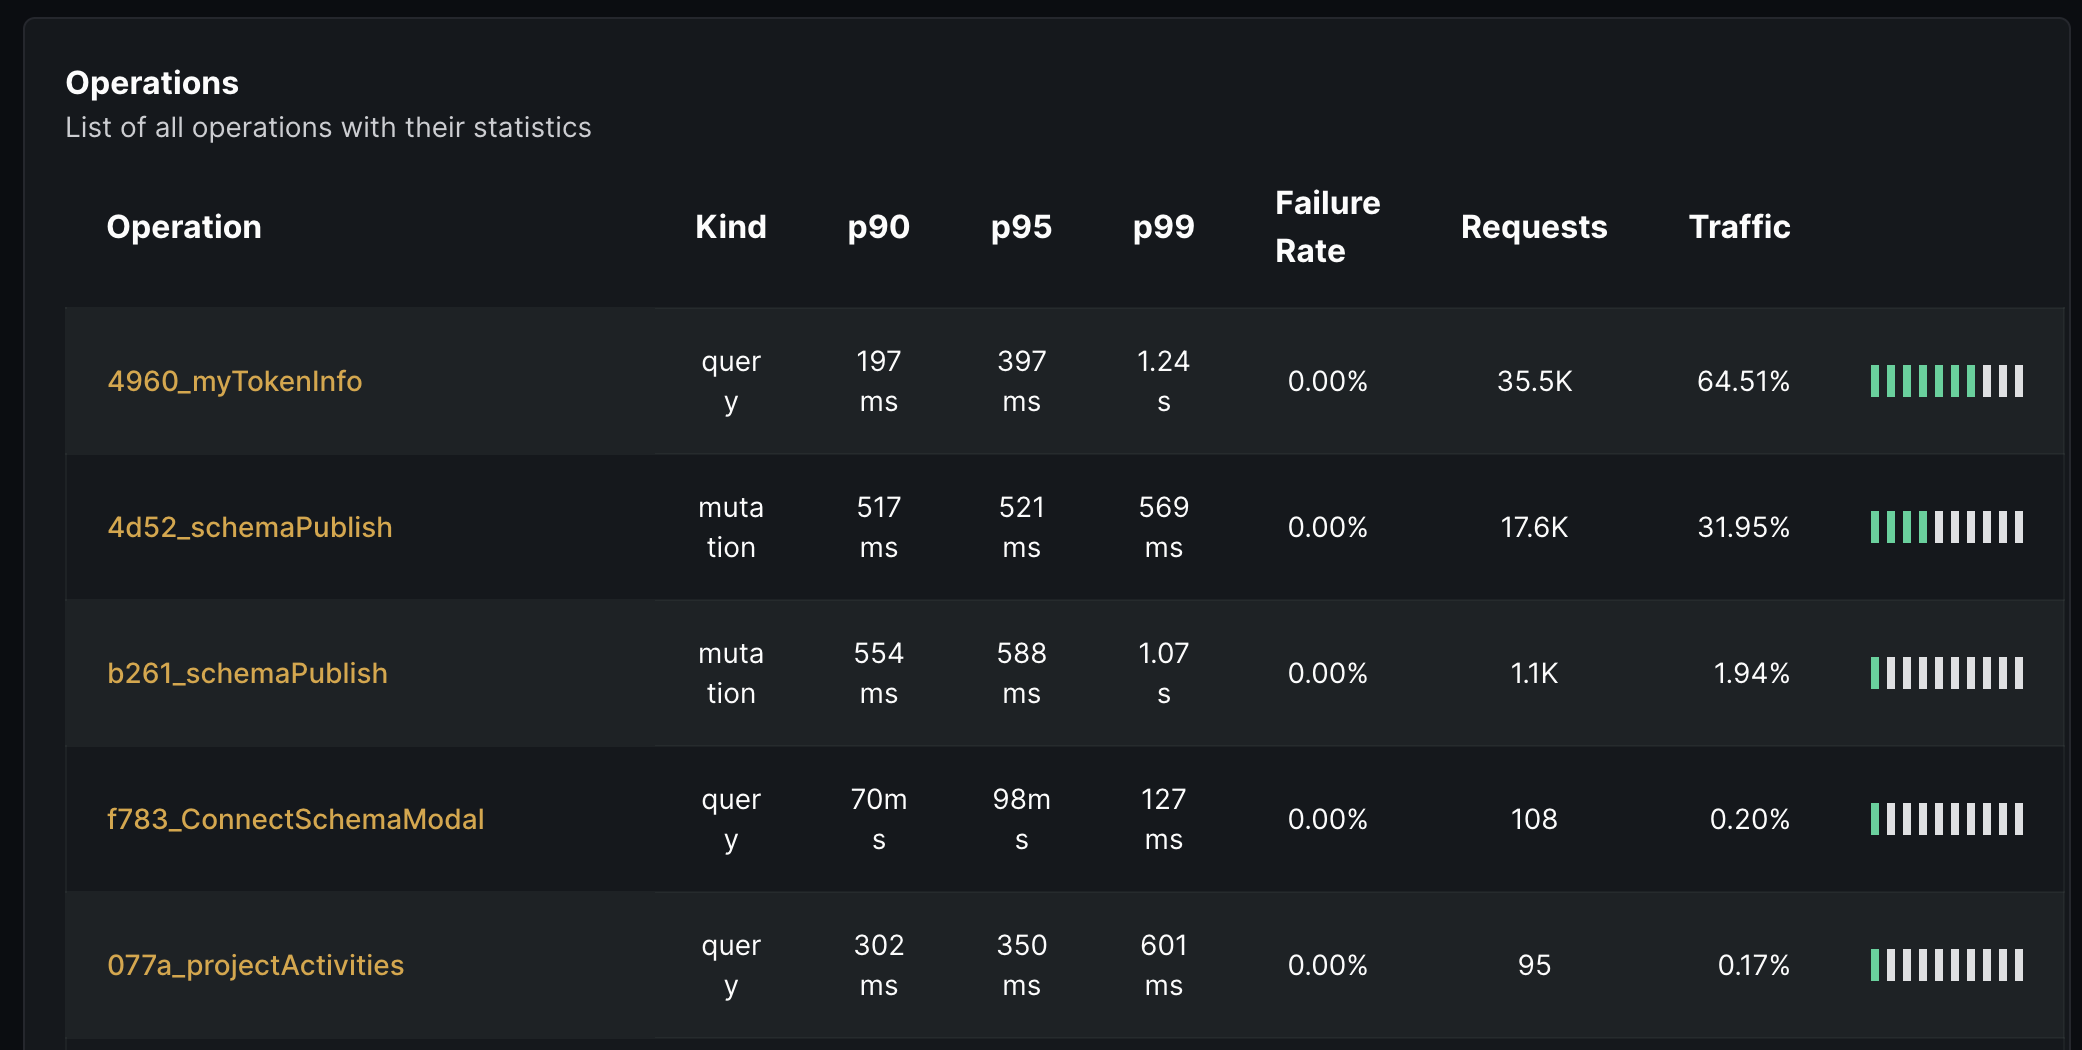
Hive Insights shows a list of all the GraphQL operations executed by your consumers and their performance metrics. This can be used to easily find outlying operations that may be slow or that have an unacceptable error rate.
By clicking on a specific query, you’ll be able to see the full list of fields and arguments used in the operation.
Usage Statistics
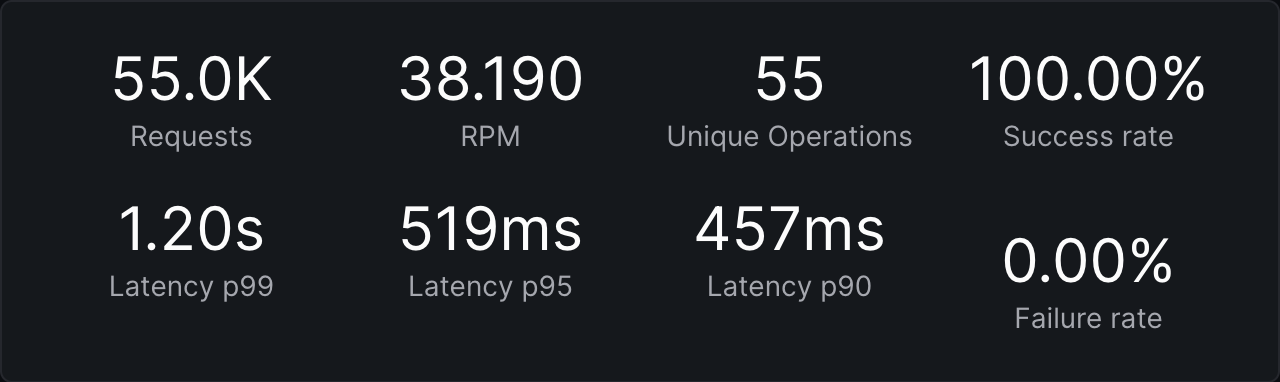
From Insights, you’ll be able to see the following metrics of your GraphQL API:
- Total amount of GraphQL executed.
- Average RPM (Requests Per Minute)
- Total count of unique GraphQL operations
- Success-rate of the executed operations
- Error-rate of the executed operations
- Latency (
p99,p95andp90)
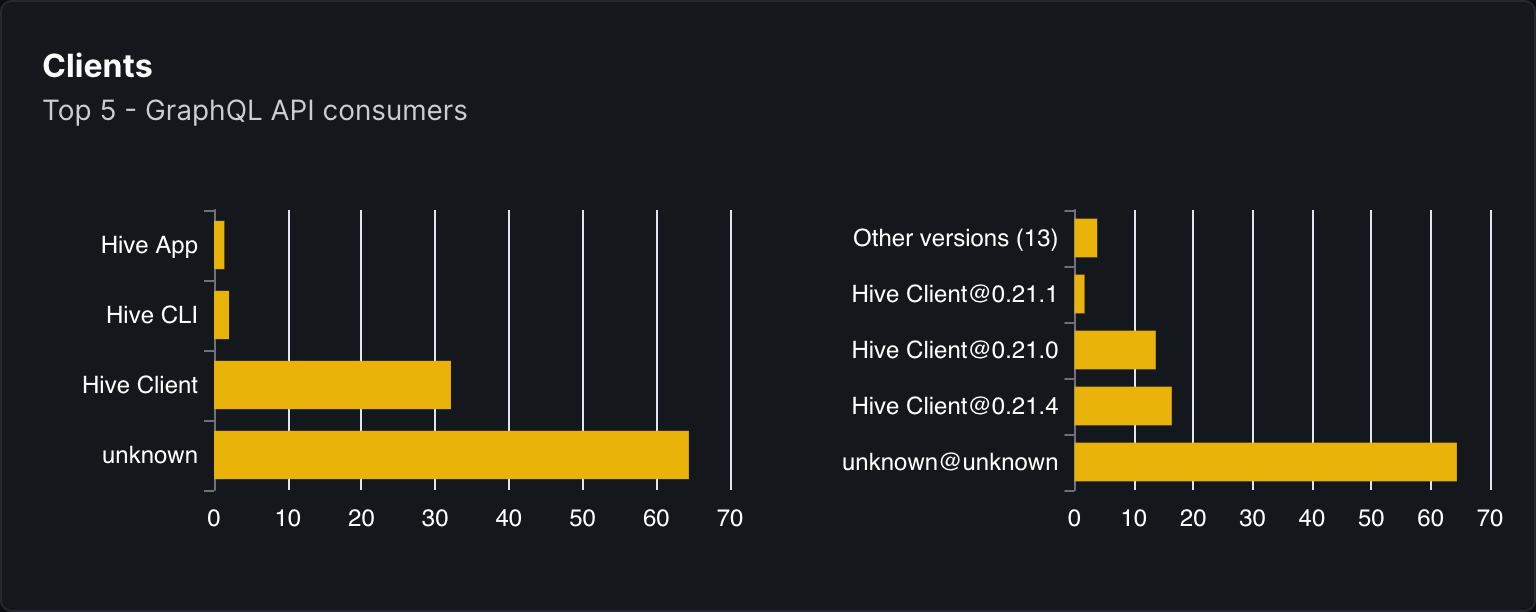
Clients Overview
A breakdown of the clients who are using your GraphQL gateway, and the amount of operations executed by each client.
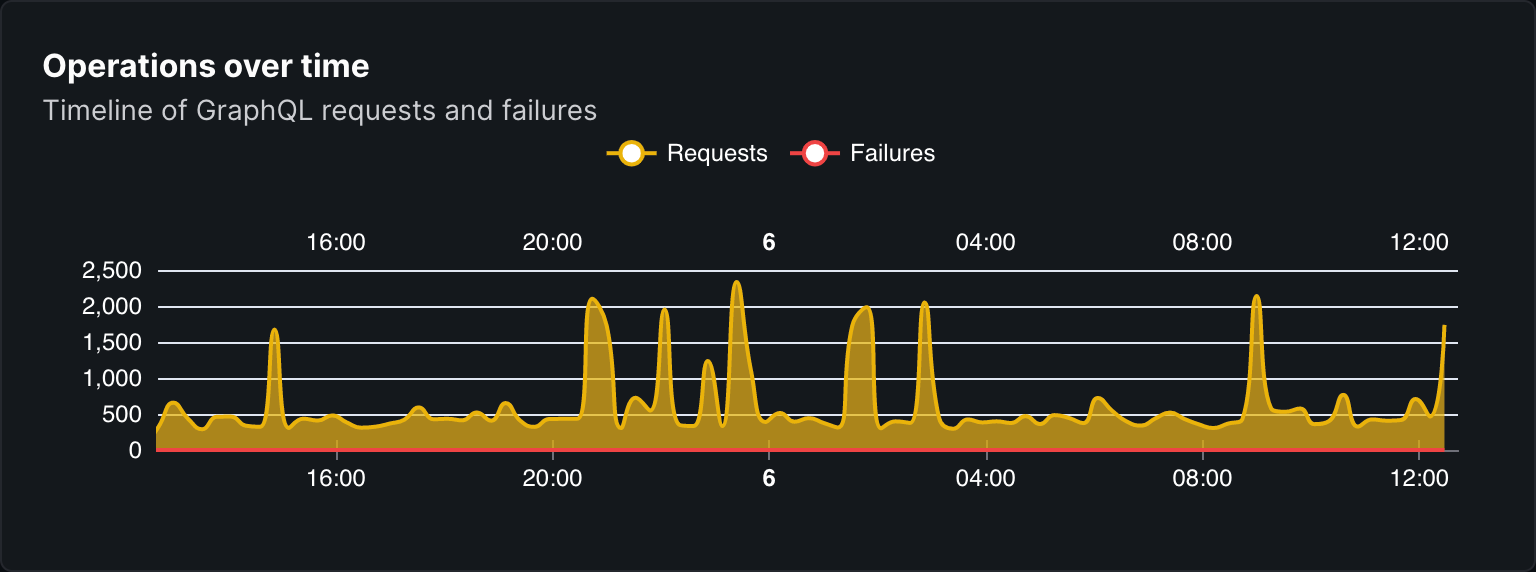
Monitoring Statistics
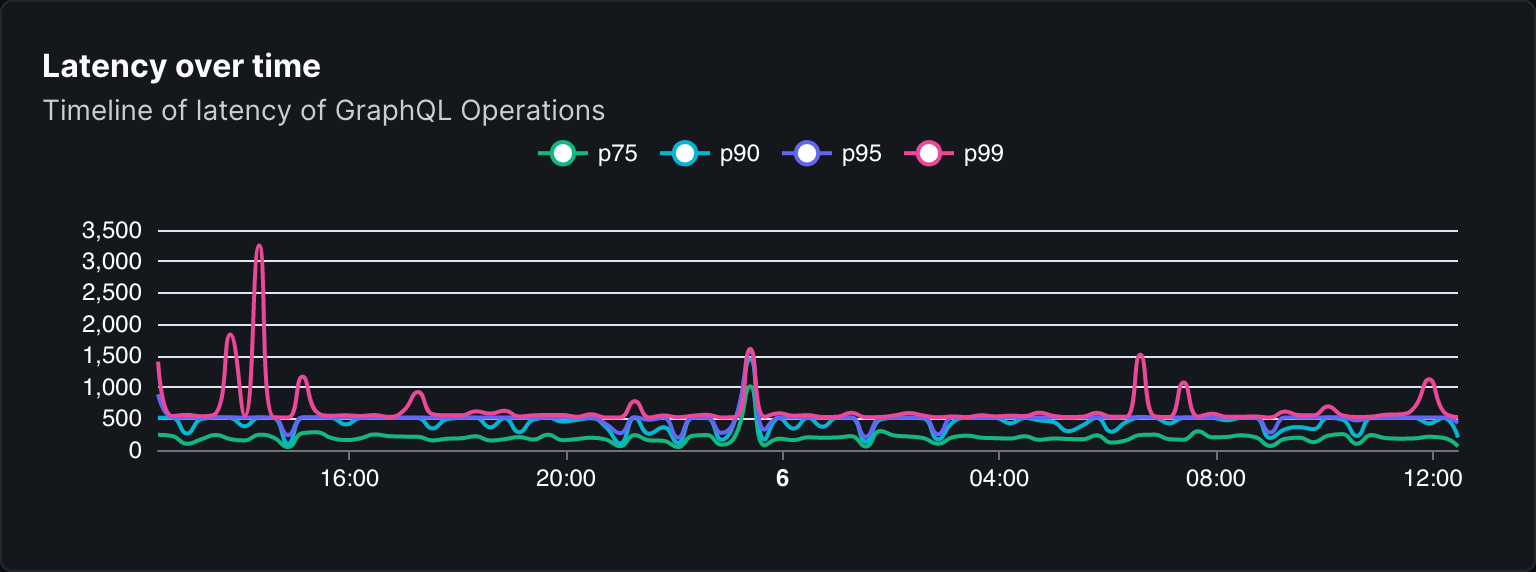
A various of the charts and metrics useful for monitoring and having an overview of your GraphQL API performance:
- Operations time: the amount of GraphQL operations executed over time.
- RPM over time: the amount of GraphQL operations executed per minute over time.
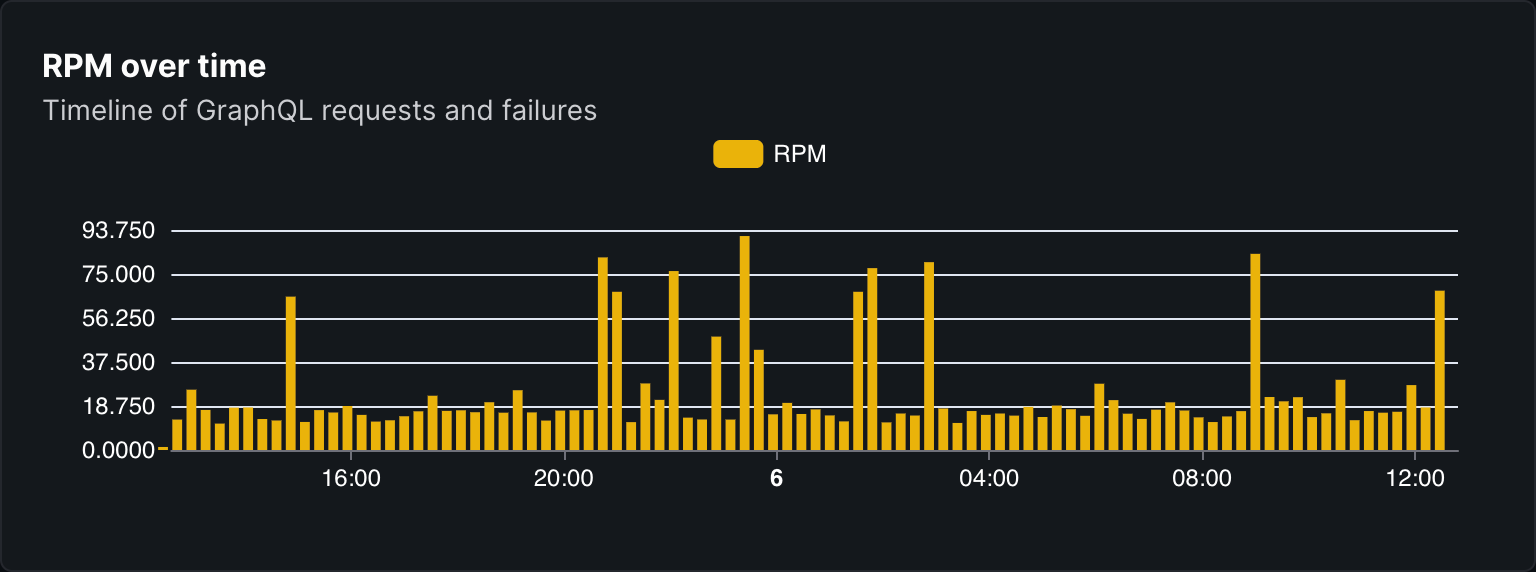
- Latency over time: the latency of GraphQL operations over time.
Tracing
In addition to usage report, you can obtain more details about your operation performances by reporting complete tracing data to Hive Tracing.
Hive Tracing shows the list of all recorded GraphQL operations executed by your customers, with all the associated spans. This can allow you to understand what takes time in an operation detected as slow in Hive Insights. It also allow to see the actual sub-queries sent to subgraphs for a given GraphQL operation.
Setup in Hive Gateway
Hive Tracing is built on top of OpenTelemetry and is integrated out of the box in Hive Gateway.
To enable traces reporting, you can either use cli options, environment variables or config file:
hive-gateway supergraph --hive-target="xxx" --hive-trace-access-token="xxx"Advanced Configuration
The integration has sain defaults for a production ready setup, but you can also customize it to
better suite your specific needs. Advanced configuration requires the use of a config file
(gateway.config.ts).
It is highly recommended to place the telemetry setup in its own file, and import it as the very
first import in gateway.config.ts. This is to ensure that any OTEL compatible third party library
that you use are properly instrumented.
import { hiveTracingSetup } from '@graphql-hive/gateway/opentelemetry/setup'

hiveTracingSetup({ accessToken: 'xxx', target: 'xxx' })import './telemetry.ts'
import { defineConfig } from '@graphql-hive/gateway'
export const gatewayConfig = defineConfig({
openTelemetry: {
traces: true
}
})Service Name and version
You can provide a service name, either by using standard OTEL_SERVICE_NAME and
OTEL_SERVICE_VERSION or by providing them programmatically via setup options
import { hiveTracingSetup } from '@graphql-hive/gateway/opentelemetry/setup'

hiveTracingSetup({
  resource: {
    serviceName: 'my-service',
    serviceVersion: '1.0.0'
  }
})
Custom resource attributes
Resource attributes can be defined by providing a Resource instance to the setup resource
option.
This resource will be merged with the resource created from env variables, which means
service.name and service.version are not mandatory if already provided through environment
variables.
npm i @opentelemetry/resources # Not needed with Docker imageimport { hiveTracingSetup } from '@graphql-hive/gateway/opentelemetry/setup'
import { resourceFromAttributes } from '@opentelemetry/resources'
hiveTracingSetup({
resource: resourceFromAttributes({
'custom.attribute': 'my custom value'
})
})Span Batching
By default, if you provide only a Trace Exporter, it will be wrapped into a BatchSpanProcessor to
batch spans together and reduce the number of request to you backend.
This is an important feature for a real world production environment, and you can configure its behavior to exactly suites your infrastructure limits.
By default, the batch processor will send the spans every 5 seconds or when the buffer is full.
The following configuration are allowed:
true(default): enables batching and useBatchSpanProcessordefault config.object: enables batching and useBatchSpanProcessorwith the provided configuration.false- disables batching and useSimpleSpanProcessor
import { hiveTracingSetup } from '@graphql-hive/gateway/opentelemetry/setup'

hiveTracingSetup({
  batching: {
    exportTimeoutMillis: 30_000, // Default to 30_000ms
    maxExportBatchSize: 512, // Default to 512 spans
    maxQueueSize: 2048, // Default to 2048 spans
    scheduledDelayMillis: 5_000 // Default to 5_000ms
  }
})
Sampling
When your gateway have a lot of traffic, tracing every requests can become a very expensive approach.
A mitigation for this problem is to trace only some requests, using a strategy to choose which request to trace or not.
The most common strategy is to combine both a parent first (a span is picked if parent is picked) and a ratio based on trace id (each trace, one by request, have a chance to be picked, with a given rate).
By default, all requests are traced. You can either provide you own Sampler, or provide a sampling rate which will be used to setup a Parent + TraceID Ratio strategy.
import { hiveTracingSetup } from '@graphql-hive/gateway/opentelemetry/setup'
import { JaegerRemoteSampler } from '@opentelemetry/sampler-jaeger-remote'
import { AlwaysOnSampler } from '@opentelemetry/sdk-trace-base'

hiveTracingSetup({
  // Use Parent + TraceID Ratio strategy
  samplingRate: 0.1,

  // Or use a custom Sampler
  sampler: new JaegerRemoteSampler({
    endpoint: 'http://your-jaeger-agent:14268/api/sampling',
    serviceName: 'your-service-name',
    initialSampler: new AlwaysOnSampler(),
    poolingInterval: 60000 // 60 seconds
  })
})
Limits
To ensure that you don’t overwhelm your tracing ingestion infrastructure, you can set limits for both cardinality and amount of data the OpenTelemetry SDK will be allowed to generate.
import { hiveTracingSetup } from '@graphql-hive/gateway/opentelemetry/setup'

hiveTracingSetup({
  generalLimits: {
    //...
  },
  spanLimits: {
    //...
  }
})
Spans, Events and Attributes
For more details about Spans, Events and Attributes configuration, please refer to
Monitoring and Tracing documentation.
Manual OpenTelemetry Setup
If you have an existing OpenTelemetry setup and want to send your traces to both Hive Tracing and
your own OTEl backend, you can use HiveTracingSpanProcessor.
For more information about setting up OpenTelemetry manually, please refer to
Monitoring and Tracing documentation
import {
  HiveTracingSpanProcessor,
  openTelemetrySetup
} from '@graphql-hive/gateway/opentelemetry/setup'
import { AsyncLocalStorageContextManager } from '@opentelemetry/context-async-hooks'

openTelemetrySetup({
  contextManager: new AsyncLocalStorageContextManager(),
  traces: {
    // Define your span processors.
    processors: [
      new HiveTracingSpanProcessor({
        endpoint: 'https://api.graphql-hive.com/otel/v1/traces',
        target: process.env['HIVE_TARGET'],
        accessToken: process.env['HIVE_TRACES_ACCESS_TOKEN']
      })

      //... your processors
    ]
  }
})